On May 1, 2004, ten new states joined the European Union, including Hungary. In our series of articles, we use various indicators to examine how Hungary’s situation has changed during our 20 years of EU membership. The topic of this article is consumption expenditure.
Annual Per Capita Consumption Expenditure in V4 Countries and Romania (in Euros)
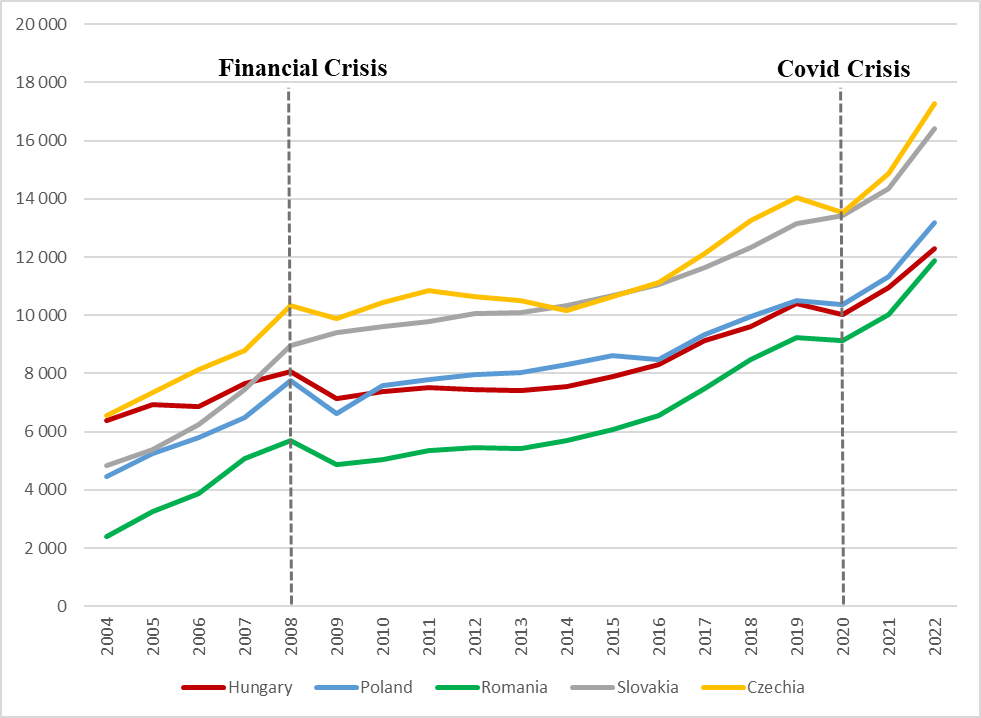
Source: Eurostat (2024)
Household consumption expenditure – unlike GDP – is a good indicator of well-being within a country. Of course, this also ignores income and wealth inequalities and does not necessarily indicate the affluence of the “average citizen”. There are basically two ways to measure consumption in international comparison: in absolute terms (how much we can buy abroad in euros after converting our currency), and in purchasing power parity (how much we can spend elsewhere at a given country’s price level).
If we examine the former, we can see that in Hungary, the level of consumption measured in euros increased steadily following EU accession in 2004, but the upward trend was broken by the financial crisis of 2008. After that – partly due to the eurozone crisis that unfolded in the early 2010s – consumption stagnated until 2015, followed by a rapid rise until 2020. Although the level of consumption fell significantly in 2020 due to the lockdowns caused by the coronavirus, the indicator has returned to a growth path in the following years.
While Hungarian consumption measured in euros has doubled over the past two decades, it remains below the European Union average. In 2022, it stood at just 47% of the EU’s overall consumption (up from 40% in 2004). (This indicator probably decreased in 2023.) We have lost our previous position not only within the EU, but also within our own region: Slovakia (2008) and Poland (2010) overtook us in the previous two decades, and it is likely that Romania will also overtake us in 2023. Overall, while we were in 20th place among the 27 member states in 2004, by 2022 we were only in 25th place (ahead of Romania and Bulgaria).
Per Capita Consumption Expenditure in Purchasing Power Parity (EU Average = 100%)
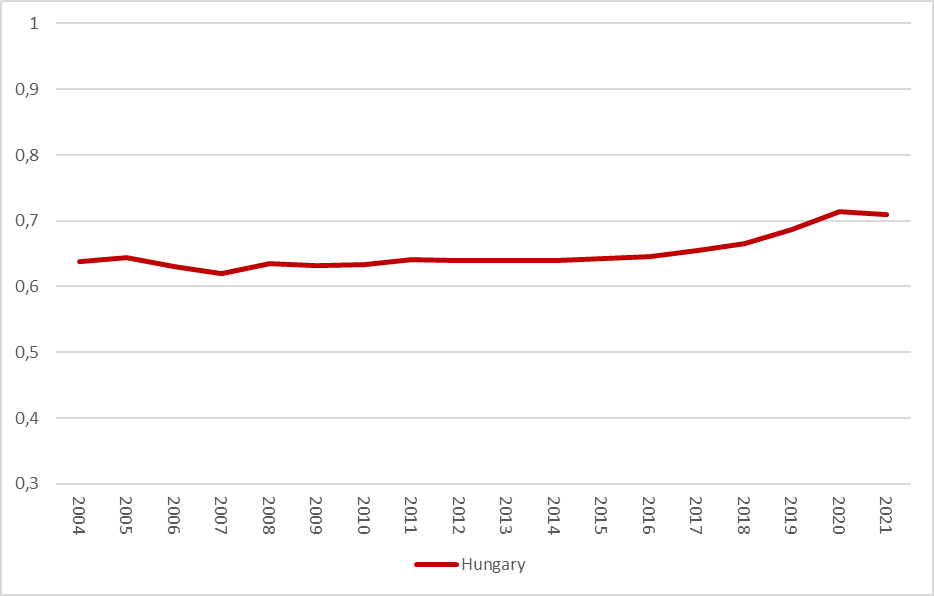
Source: Eurostat (2024)
If we examine consumption in purchasing power parity, we can observe a slight convergence. The value of the indicator in Hungary was 64% of the EU average in 2004, and then increased to 73% by 2022 (this is mainly due to the period between 2018 and 2020). However, it’s important to note that Hungary’s ranking in consumption relative to other EU countries has declined. Hungary has slipped from 19th place to 26th place, with only Bulgaria behind.
Download full analysis