On May 1, 2004, ten new states joined the European Union, including Hungary. In our series of articles, we use various indicators to examine how Hungary’s situation has changed during our 20 years of EU membership. The topic of this article is price changes.
We face the effects of price changes from time to time. Electricity bills are rising, bread is becoming more expensive in the store, our hairdresser is raising his rates. This is perfectly fine as long as it happens at a low rate, in parallel with the rise in wages. In the developed world, central banks aim to maintain a slow, predictable rate of price increases.
Price level changes in V4 countries, EU and Romania (2004=100%)
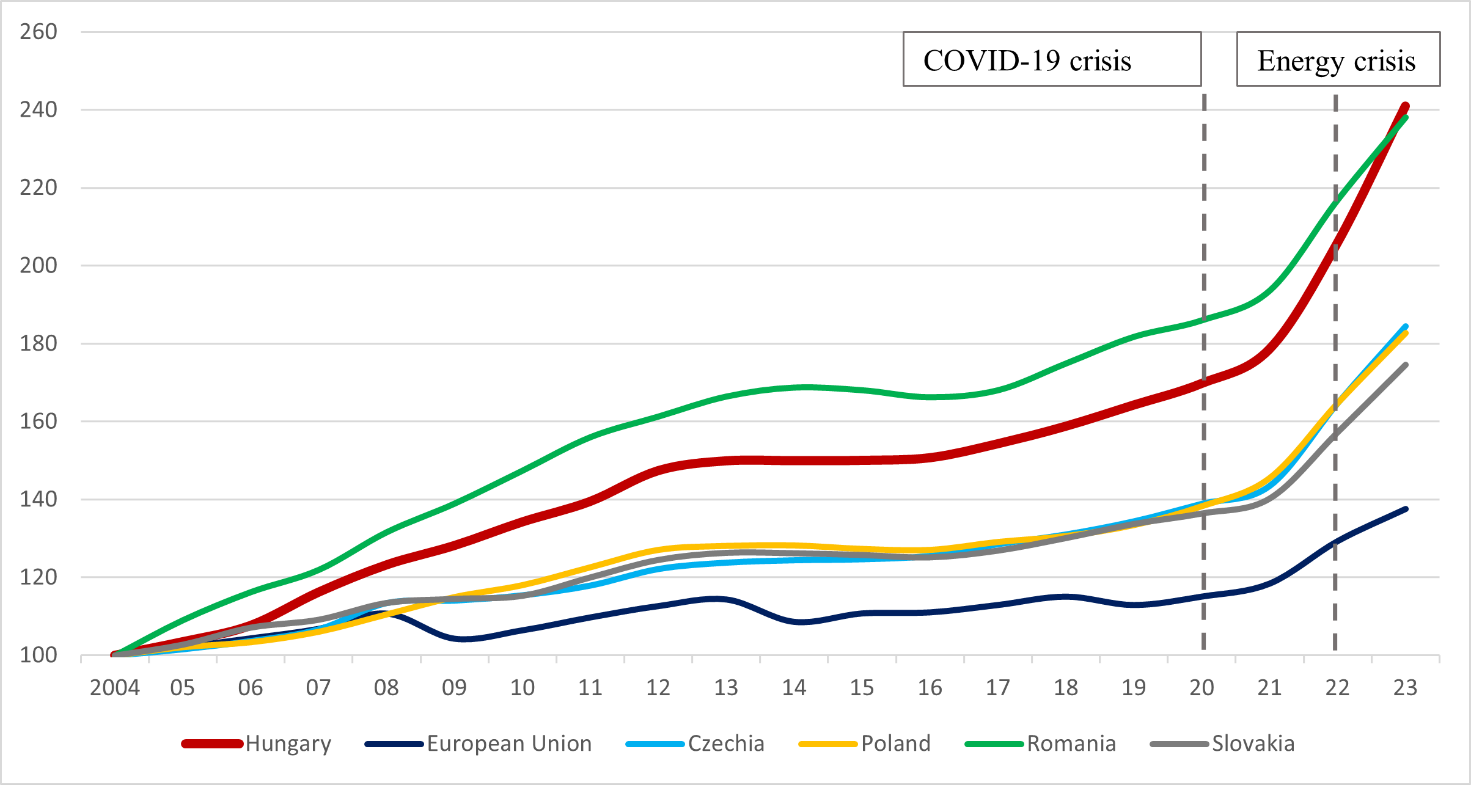
Source: Eurostat (2024), own ed.
The average annual price increase in the EU between 2004 and 2020 was 1 per cent. Subsequently, supply chain disruptions caused by the coronavirus crisis tightened the supply side, driving up prices. In addition, the anti-crisis economic policies of European governments have inevitably contributed to rising inflation. The energy crisis unfolding in the wake of the Russia-Ukraine war has led to a further increase in price levels. Between 2020 and 2023, EU price levels increased by 20 per cent.
Prices in Hungary increased one and a half times between 2004 and 2013. Subsequently, consumer prices stagnated in the mid-2010s due to the deflationary global economic environment and the government’s reduction in utility charges. However, the second half of the decade saw a reversal of the previous trend. As a result of the coronavirus crisis, election spending (and subsequent tax increases) and the increase in energy prices, Hungarian consumers faced unprecedented price increases. Overall, domestic prices have increased 2.4 times over the past two decades (the EU average was 1.4 times).
Of course, for countries starting from a lower level of development, as productivity and wages rise, so do prices. It is therefore worth comparing domestic price levels with prices in other countries in the region.
Prices in the Czech Republic, Slovakia and Poland have moved almost in tandem over the past two decades. Hungarian price growth was higher than that of the other Visegrad countries between 2006 and 2012, and then levelled off until 2017. After that, prices in Hungary increased again more rapidly. Although the rate of price change was lower in Hungary compared to Romania for most of the period under review, we managed to “catch up” with our eastern neighbour by 2023. All this clearly shows that the main goal of Hungarian economic policy in the previous twenty years was not to bring down inflation.
Price level change in Hungary (measured in purchasing power parity, EU27=100%)
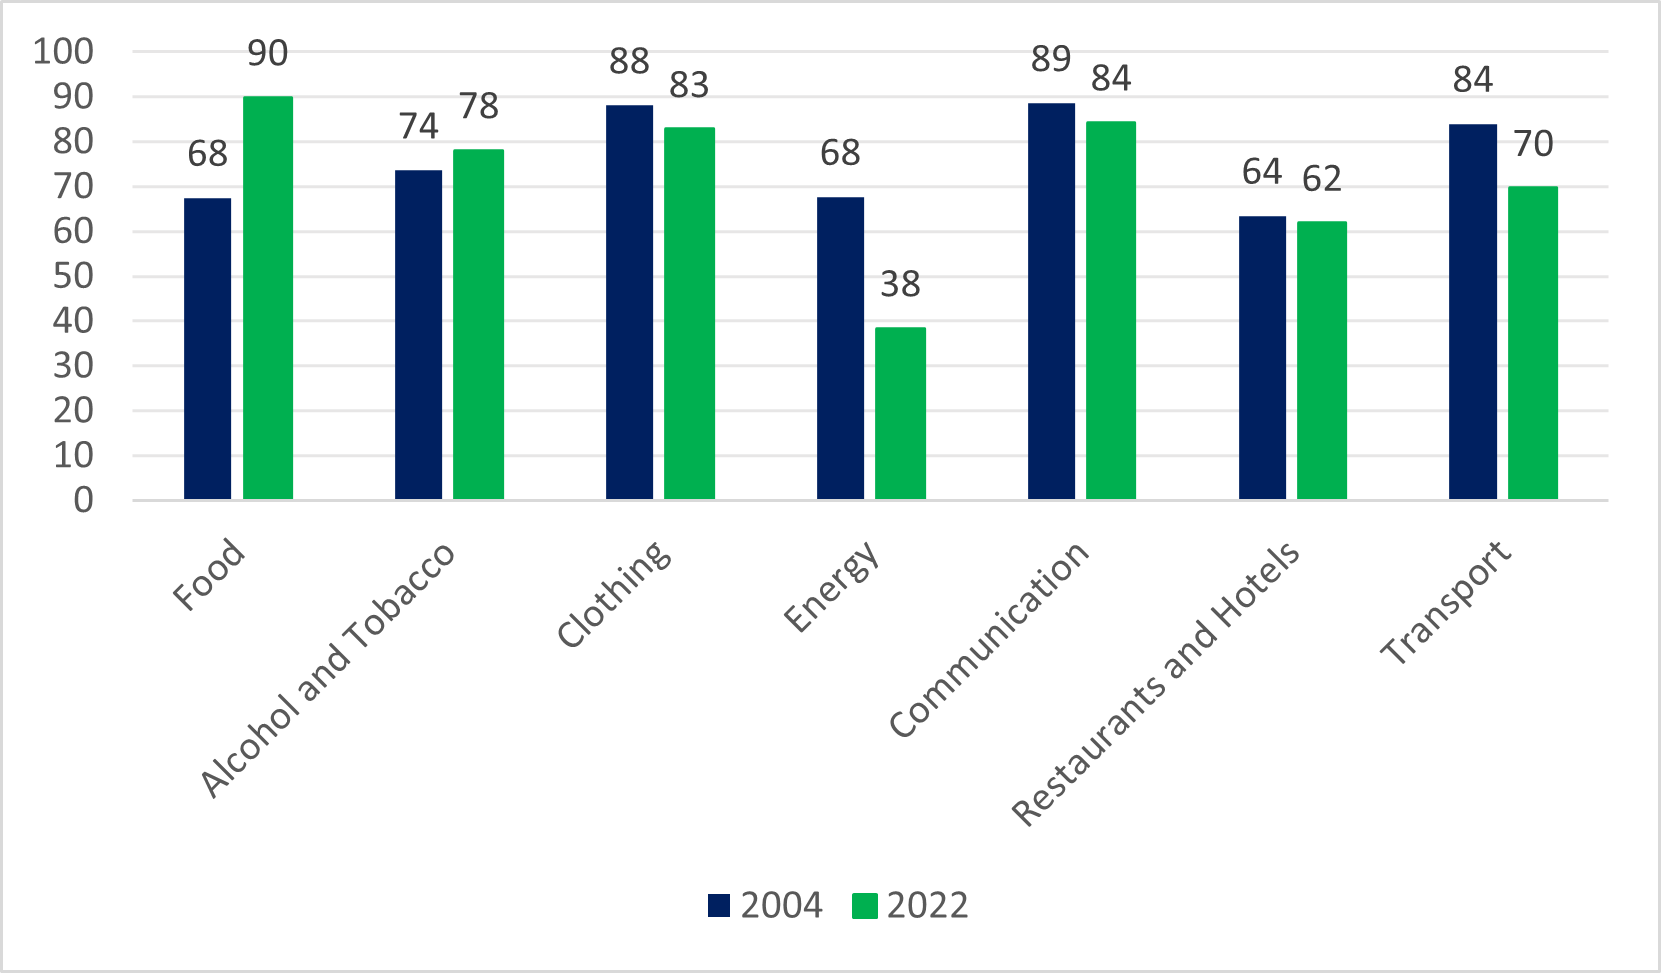
Source: Eurostat (2024)
Important lessons can be drawn by looking at price changes for some product groups separately. For marketized goods and services (clothing, communication, hotels and restaurants) only very low relative price changes compared to the EU average can be observed over the previous two decades at purchasing power parity. The exception is food, on which households spend 21.7 per cent1 of their income. The increase here was drastic: while in 2004 prices stood at two-thirds of the EU average, by 2022 they rose to 90 per cent. (The MNB estimates that by 2023 this figure was 96 per cent of the EU average.)
2
Overall, the price of consumer goods in Hungary (measured in purchasing power parities) was 76.7 per cent of the EU average in 2004, and remained essentially unchanged over the previous twenty years. By contrast, the price of services (mainly due to real wage growth) rose from 50.7 per cent to 56.2 per cent of the EU average.
However, there has been a relative fall in prices in government-controlled sectors. Thanks to the reduction in utility charges, energy prices fell from 67.7 per cent of the EU average to 38.4 per cent. In (public) transport, a similar trend can be observed: neither the government, nor the capital, nor the other municipalities have increased ticket prices in line with inflation, making these services relatively cheaper than the EU average. With the introduction of subsidized country and county passes and their acceptance in public transport in the capital, a further decrease is expected in the future.
Certainly, the escalating real costs are also paid for in other ways: through increasing fare subsidies funded by tax revenues, declining service standards, and underinvestment in various areas such as infrastructure (roads, water and sewage networks), education, healthcare and social services.
1Based on HCSO data for 2023.
2MNB Inflation Report (2023, page 22).
Download full analysis