On May 1, 2004, ten new countries, including Hungary, joined the European Union. In this series of articles, we explore how various indicators have evolved over our 20 years of EU membership. This article focuses on foreign trade.
Hungary is a small, open economy with an export-driven growth model. Between 2004 and 2008, the volume of domestic exports doubled in just four years. However, we felt the downsides of exposure to international economic processes during the subsequent period: the 2008 financial crisis led to a 22% decrease in the export of domestic goods and services in 2009. After recovering from the crisis, exports stagnated in the first half of the 2010s but resumed growth by the end of the decade, which was interrupted by the COVID-19 crisis in 2020. This was followed by a strong rebound over the next two years. Overall, between 2004 and 2022, the volume of domestic exports grew by 2.6 times—an impressive achievement, but not as notable in regional comparison. The Slovaks increased their exports by 2.9 times, the Czechs by 3.2 times, and the Poles by nearly five times.
Change in Export Volume in V4 Countries (2004=100%), 2004-2022
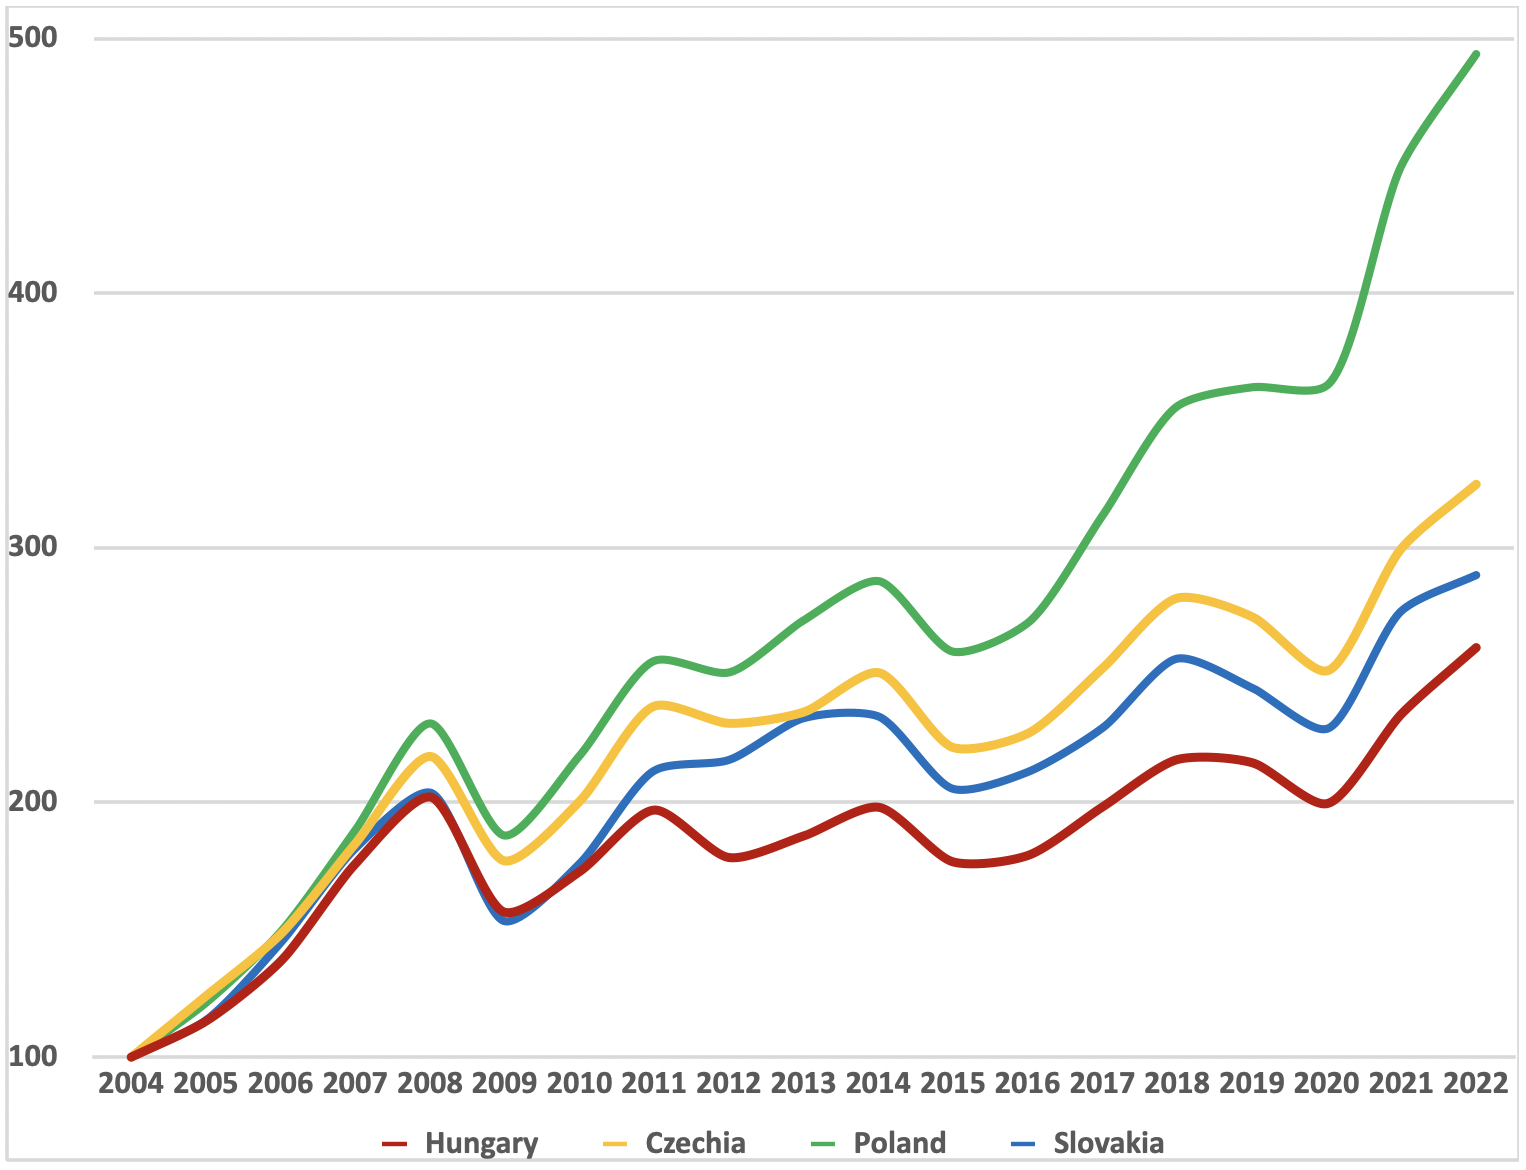
Source: Calculations by GKI based on World Bank data (2024)
In 2004, Hungarian exports accounted for 60% of GDP, rising to 91% in 2022. This 31 percentage point increase was the highest among the V4 countries, indicating a drastic increase in our exposure to external markets.
Parallel to our deeper integration into the EU, both our exports and imports have grown. While Hungary’s GDP-proportional imports were 66% in 2004, this rose to 96% by 2022. Significant imports accompany exports, as a large part of manufacturing exports comes from assembly.
Despite various “openings” (to Arab countries, South America, Africa, Asia, and Russia), the EU remains our most significant foreign trade partner: in 2023, 77% of our export turnover and 69% of our imports were within the Union, a minimal decrease from 79% and 72%, respectively, in 2004.
Hungary’s Foreign Trade Balance (million euros), 2017-2023
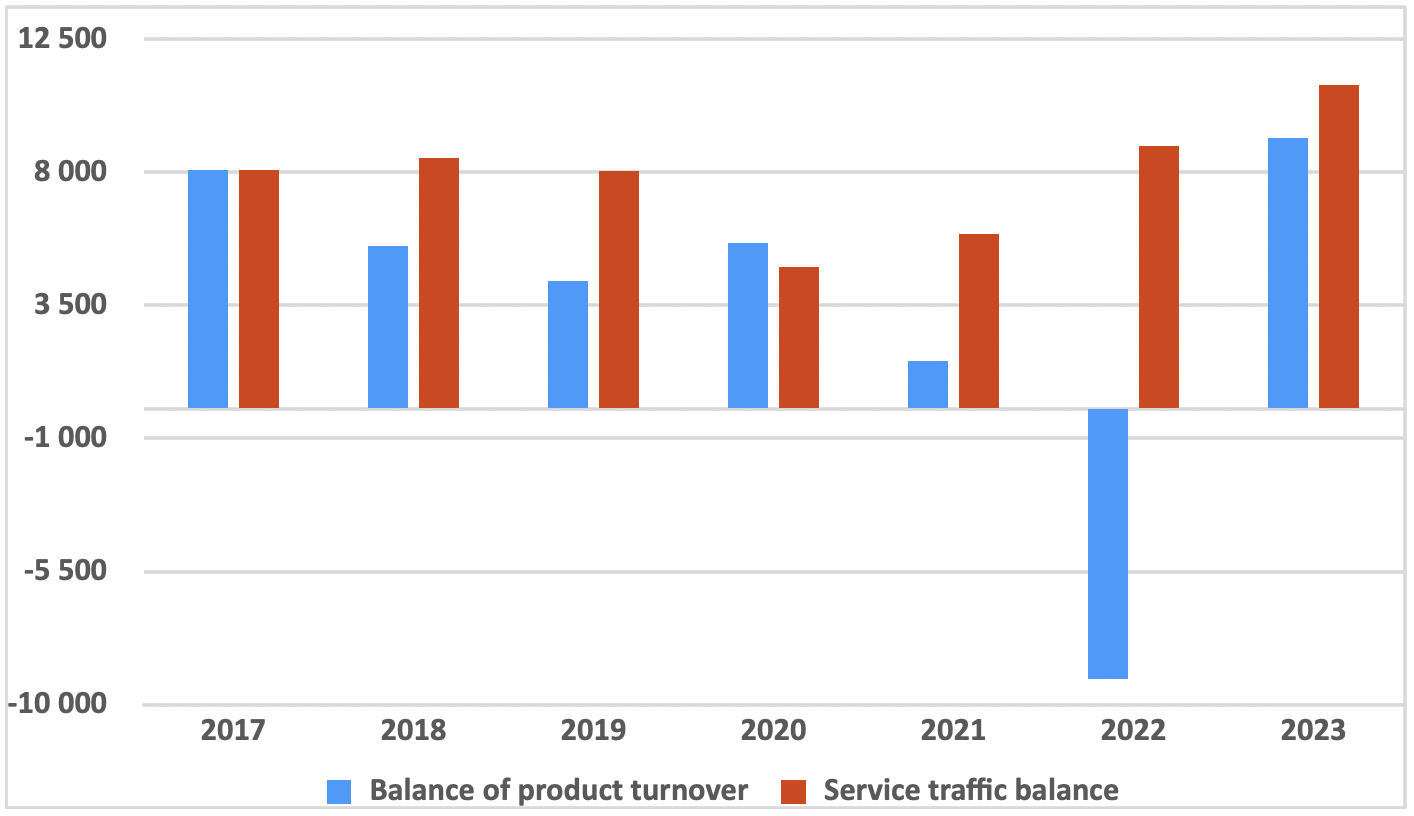
Source: Hungarian Central Statistical Office (Product Traffic, Services), (2024)
About four-fifths of our foreign trade consists of goods traffic, with the remaining one-fifth being services traffic. Typically, both show a positive foreign trade balance; however, since 2017 (except for 2020), a larger surplus has come from services. The largest part of service exports comes from tourism, but the balance of business services has improved the most in recent years. Therefore, favorable foreign trade data are primarily not due to reindustrialization, especially when considering the direct and indirect (e.g., energy) import content of the manufacturing industry.
Download full analysis