

Next week, Hungary will announce the minimum scores required for university admission, offering a timely opportunity to examine long-term trends in higher education. The GKI Economic Research Institute has explored how enrolment and preferences have evolved over the past decade and a half.
How many students attend university?
Since 2010, the number of students in Hungarian higher education has followed a U-shaped trajectory. That year, 318,000 students were enrolled. After a gradual decline, the figure stabilized around 250,000 by 2022—a drop of more than 20%. However, a trend reversal appears to be underway: student numbers rose to 272,000 in 2023 and further to 293,000 in 2024. Despite this, the figure still lags behind levels seen 15 years ago. [1]The size of the relevant age group (18–23 years) shrank by 18% over the same period. While in 2010, 42% of the corresponding age group were students, in 2024 it was 48%.
The sharp drop in applications in the early 2010s (about 20%) was primarily triggered by the expansion of tuition fees. Since then, the number of applicants has largely stagnated, fluctuating only mildly, while the number of accepted students has been slowly increasing. This is because the success rate has been steadily increasing since the second half of the 2010s: in 2016, 67% were happy at the point of admission, rising to 77% in 2024[2].
Share of fields of study in the total number of students (2010, 2024, %)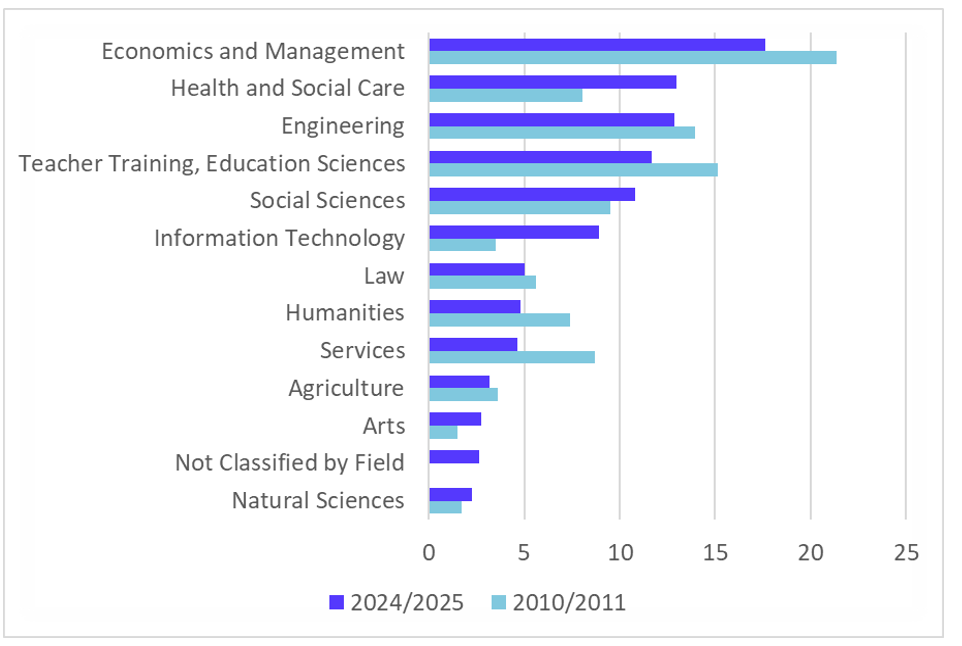
Source: KSH.
What do students study?
Although economics-related programs have lost some of their appeal in recent years, they still attract the highest share of students—18% of the total. Health and social care fields have seen a notable rise, increasing from 8% to 13%, making it the second most popular area of study. Engineering disciplines hold third place.
Teacher training saw a surge in enrolment following recent wage increases in the sector, yet the proportion of students in this area—currently at 12%—remains below its 2010 level of 15%. The most dynamic growth occurred in information technology: its share jumped from 3.5% to 9% over the past decade and a half.
Gender differences in education
Since 2010, women have consistently made up around 54% of the student body, slightly overrepresented in overall terms. However, there is considerable variation across disciplines. Women dominate teacher training programs (82%), followed by health and social care (71%). They also comprise a large majority in the arts, humanities, social sciences, and law.
Share of women in total student population, by field of study (2010, 2024, %)
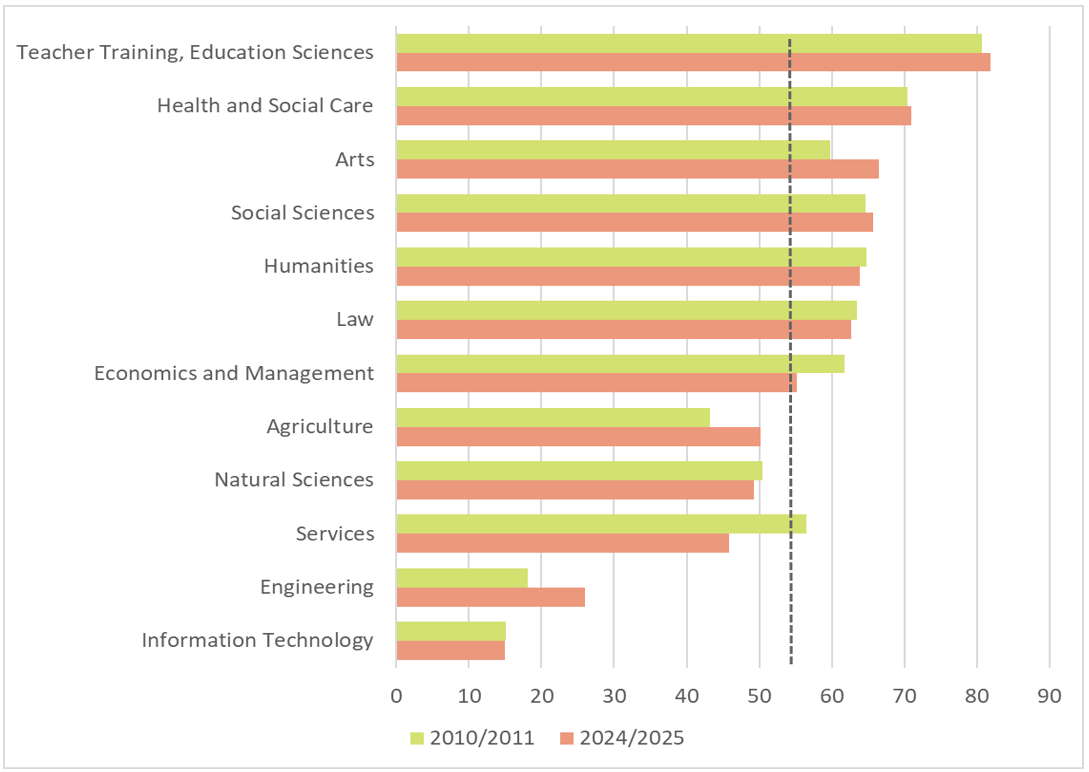
Source: KSH.
Note: the dashed grey line shows the average proportion of women out of the total student population
Conversely, they remain significantly underrepresented in engineering (26%) and, even more starkly, in IT (15%). A positive development is that the share of women in engineering has risen by 8 percentage points over the past 15 years. No such progress has been observed in IT.
A noteworthy initiative addressing this imbalance is the “Girls’ Day” programme organised by the Association of Women in Science. The initiative seeks to bring STEM (science, technology, engineering, mathematics) disciplines closer to potential female students and improve gender balance in these crucial fields.