Net capital income refers to post-tax income derived from savings and investments (for example in the form of dividends, interest or capital gains), and its distribution provides a good proxy for wealth disparities within a country. According to data from the National Tax and Customs Administration (NAV), the number of individuals receiving capital income rose from 356 thousand to 362 thousand in 2024, an increase of around 1.5%. The total amount of declared net capital income reached 2,840 billion forints, up 7% compared with 2023. Average net capital income per recipient was 7.8 million forints, equivalent to 291 thousand forints per capita.
GKI also examined how capital incomes were distributed across municipalities in 2024. By settlement type, the highest average net capital income per recipient was recorded in the capital, Budapest, at 11 million forints. This is well above the rest of the country: in county seats and cities with county rights the figure was 7.4 million forints, in other towns 6.5 million, and in large villages and villages 6.2 million forints per recipient. Budapest accounts for 35% of total net capital income, even though only 25% of capital-income earners live there. County seats and cities with county rights generate 21% of total capital income, while towns account for 25% and villages for 17%. In 180 municipalities, no capital income was recorded at all.
The distribution of net capital income per capital-income earner by municipality in 2024
(million forints)
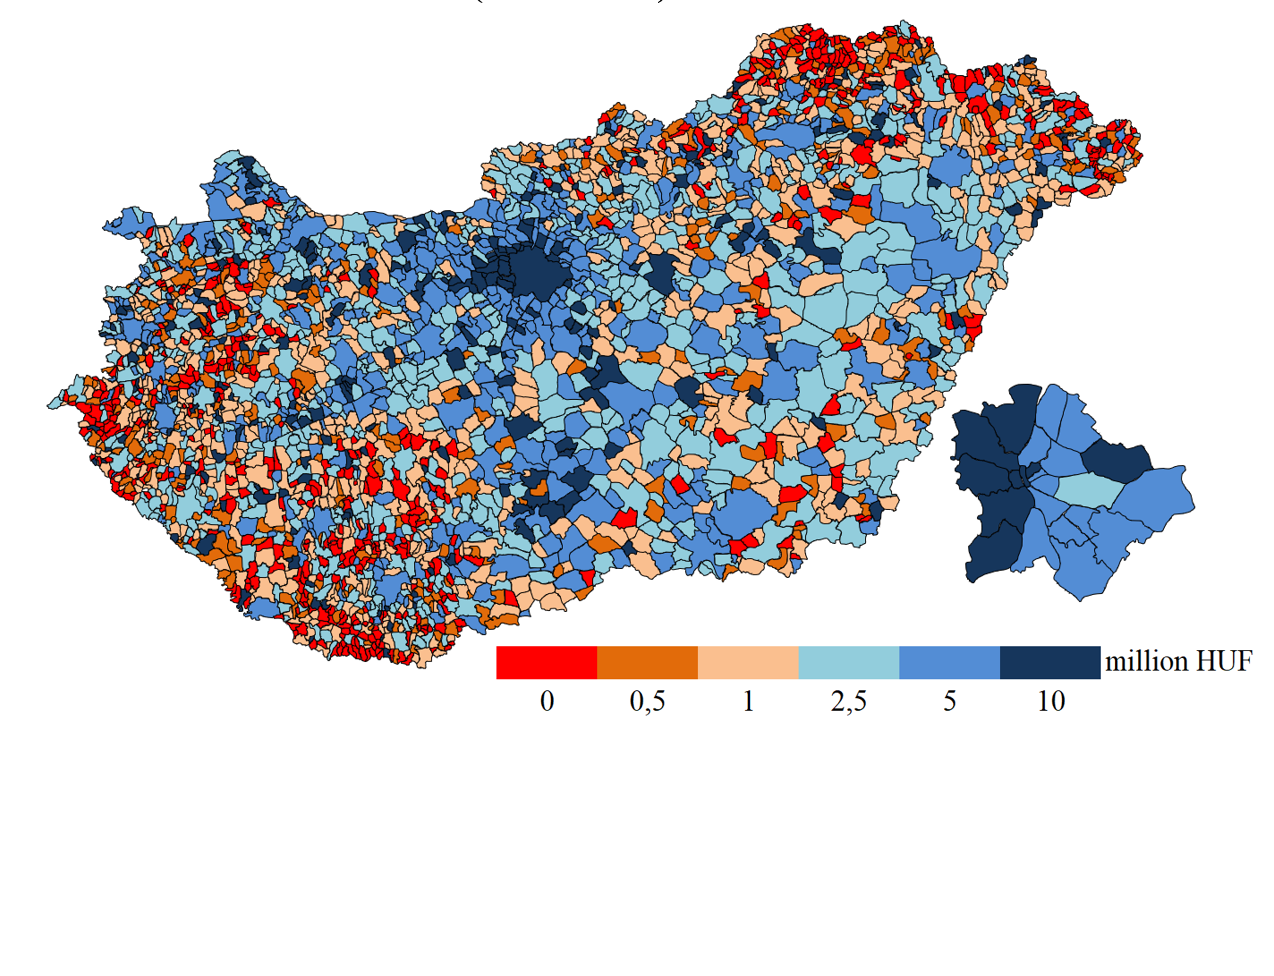
Source: NAV PIT data, GKI calculation
In a county-level comparison, Fejér county recorded the highest net capital income per recipient, at 11.2 million forints – surpassing even Budapest. This owes largely to Felcsút’s exceptional figure of more than 1 billion forints; without it, the county average would be closer to 5 million. Felcsút’s 124% expansion in capital income also helps explain why average net capital income per recipient in Fejér county rose by 37% year on year. At the other end of the scale, Békés county posted the lowest per-capita capital incomes, at 3.7 million forints.
The distribution of net capital income per capita by municipality in 2024
(thousand forints)
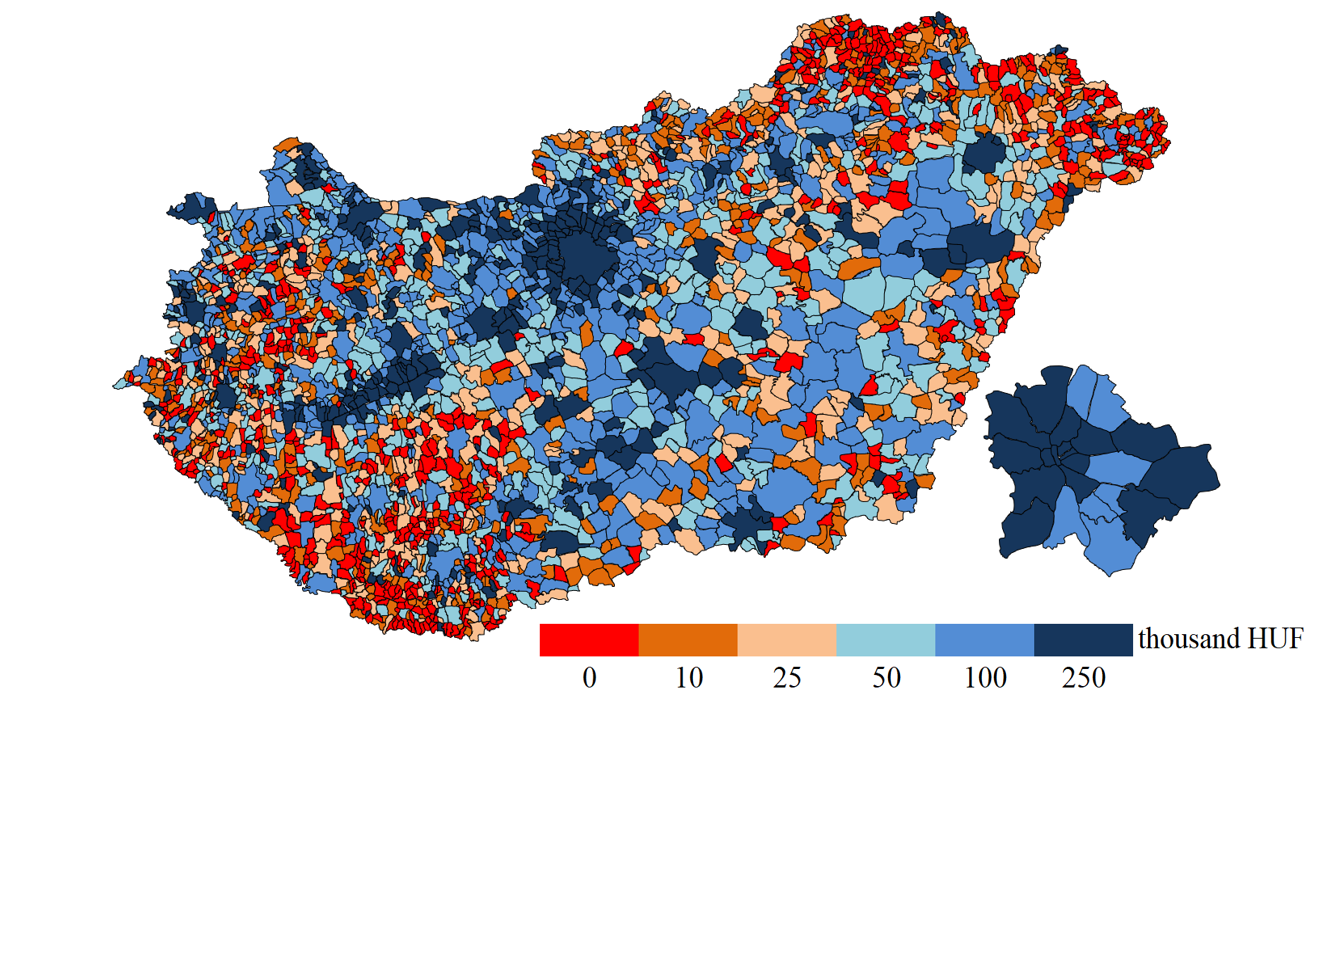
Source: NAV PIT data, GKI calculation
Measured per capita (that is, relative to permanent residents), net capital income in Budapest was twice as high as in cities with county rights – 616 thousand versus 307 thousand forints. In other towns it stood at 228 thousand, and in villages at 159 thousand forints annually. The national average was 290 thousand forints. The area around Lake Balaton stands out, where a high number of tourism-based businesses pushes per-capita capital income up; yet, since these are mostly small enterprises, the average per recipient is far less remarkable. Nógrád county recorded the lowest per-capita capital income, at 95 thousand forints, while Fejér county had the highest, at 371 thousand. This owes to the previously noted outlier in Felcsút, whose per-capita capital income more than doubled from the previous year, reaching just over 31 million forints in 2024. The second highest remained Vaskeresztes, with 12.5 million forints, followed by Bihardancsháza at 9 million.
Among settlements with at least town status, labour and capital incomes show a correlation of 0.8 – a strong co-movement. In other words, cities with higher labour incomes also tend to have higher capital incomes. This reflects the fact that higher earnings typically lead to higher savings and investment rates, boosting a municipality’s capital income and further deepening wealth disparities between settlements. In addition, greater purchasing power supports more businesses, which can in turn raise returns on capital.
| Settlement type | Net capital income per recipient, 2024 (million HUF) | Change (thousand HUF) | Change
(%) |
Net capital income per capita (thousand HUF) |
| Capital (Budapest) | 11.04 | 230 | 2.1% | 616 |
| Cities with county rights and county seats | 7.43 | 257 | 3.6% | 307 |
| Towns | 6.52 | 524 | 8.8% | 228 |
| Villages and large villages | 6.23 | 434 | 7.5% | 159 |
| County | Net capital income per recipient, 2024 (million HUF | Change (thousand HUF) | Change
(%) |
Net capital income per capita (thousand HUF) |
| Fejér | 11.23 | 3 003 | 36.5% | 371 |
| Pest | 9.2 | 600 | 7% | 363 |
| Országosan | 7.84 | 402 | 5.4% | 287 |
| Győr-Moson-Sopron | 7.06 | -253 | -3.5% | 265 |
| Bács-Kiskun | 7.72 | 783 | 11.3% | 251 |
| Veszprém | 5.32 | 182 | 3.6% | 231 |
| Komárom-Esztergom | 6.64 | 449 | 7.3% | 230 |
| Csongrád-Csanád | 6.37 | 910 | 16.7% | 227 |
| Hajdú-Bihar | 6.38 | 491 | 8.3% | 211 |
| Vas | 5.64 | 451 | 8.7% | 188 |
| Zala | 4.83 | 170 | 3.7% | 187 |
| Somogy | 4.99 | 401 | 8.7% | 169 |
| Jász-Nagykun-Szolnok | 6.42 | 1 204 | 23.1% | 168 |
| Heves | 5.3 | 614 | 13.1% | 164 |
| Baranya | 5.4 | -1 189 | -18.1% | 159 |
| Tolna | 4.54 | -1 844 | -28.9% | 139 |
| Szabolcs-Szatmár-Bereg | 5.2 | -25 | -0.5% | 129 |
| Békés | 3.7 | -125 | -3.3% | 114 |
| Borsod-Abaúj-Zemplén | 4.63 | -173 | -3.6% | 109 |
| Nógrád | 4.03 | -131 | -3.2% | 95 |