The escalating US-Iran conflict in 2026 – similar to the Russian aggression in 2022 – resulted in a significant increase in energy market prices and increasing inflationary pressure in the world: the explosive increase in energy prices and the spillover effects of increased risks related to supply chains are pushing prices up. The GKI analysis examines the current affordability of fuels in Hungary, the EU and the V3 countries.[1]
Consumer prices of fuels in Hungary, the EU and the V3 countries, 2010-2026 (euro/liter)
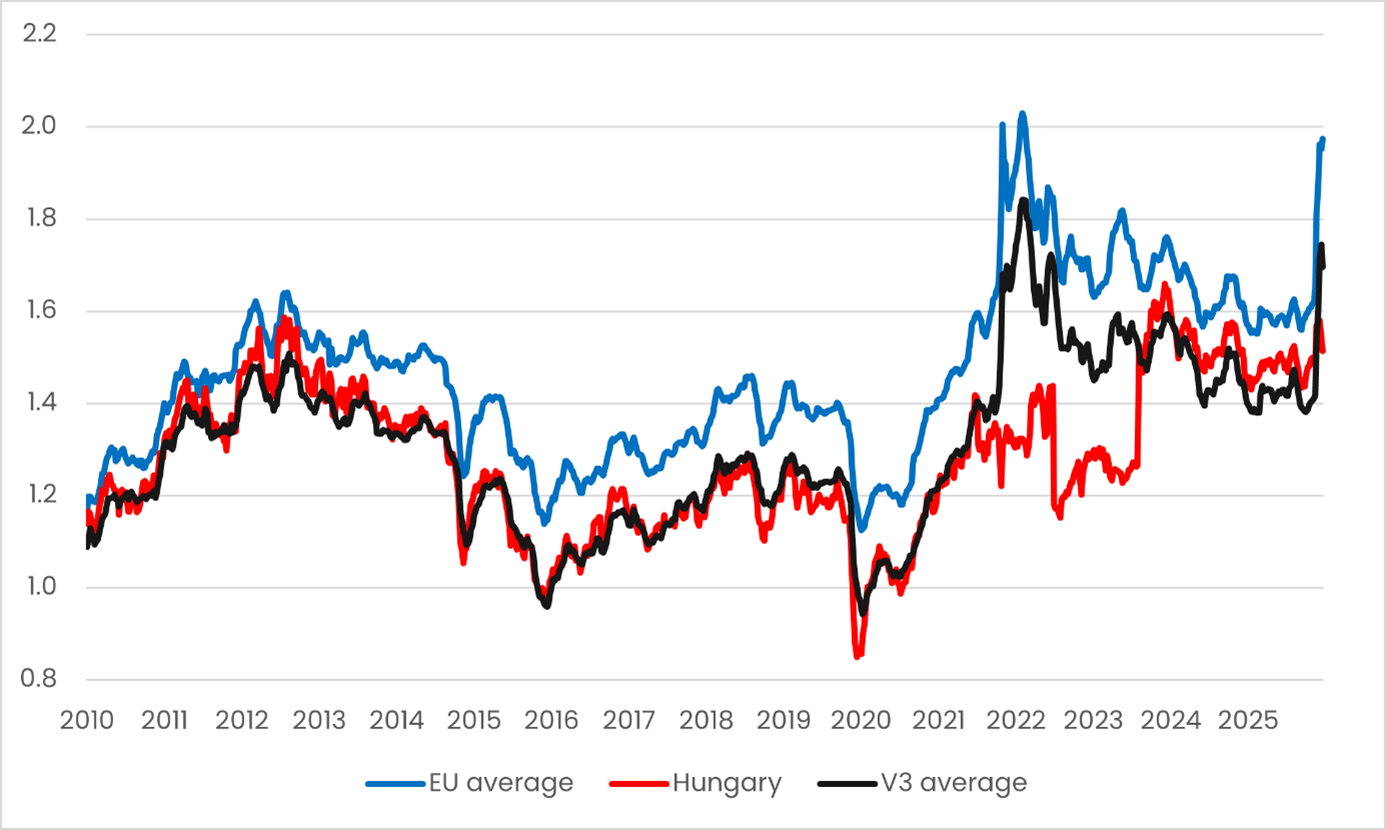
Source: European Commission , GKI calculation
In Hungary, active government interventions have moderated fluctuations in consumer fuel prices in recent years. This control is well illustrated by the price restrictions applied during the two energy crises (2022-23, 2026) and the fact that the excise tax rate was also reduced in March this year. In “peacetime”, domestic fuel prices move closely together with prices in the other Visegrad countries, but in crisis situations – due to different economic policy responses – these paths diverge. In such cases, the average price in the other Visegrad countries typically exceeds the domestic price (for example, in the period 2020-2022 and starting from March 2026). Fuels are permanently more expensive in most EU countries than in ours, which can be explained by the higher price level, the higher excise tax burden, and the market-oriented economic policy environment.
Government reactions to rising prices due to the Iranian conflict were very similar in European countries (excise taxes, VAT – noncompliant to EU VAT directive – or other taxes on fuels were reduced).
Fuel affordability (amount of fuel that can be purchased with a monthly net income, liters)
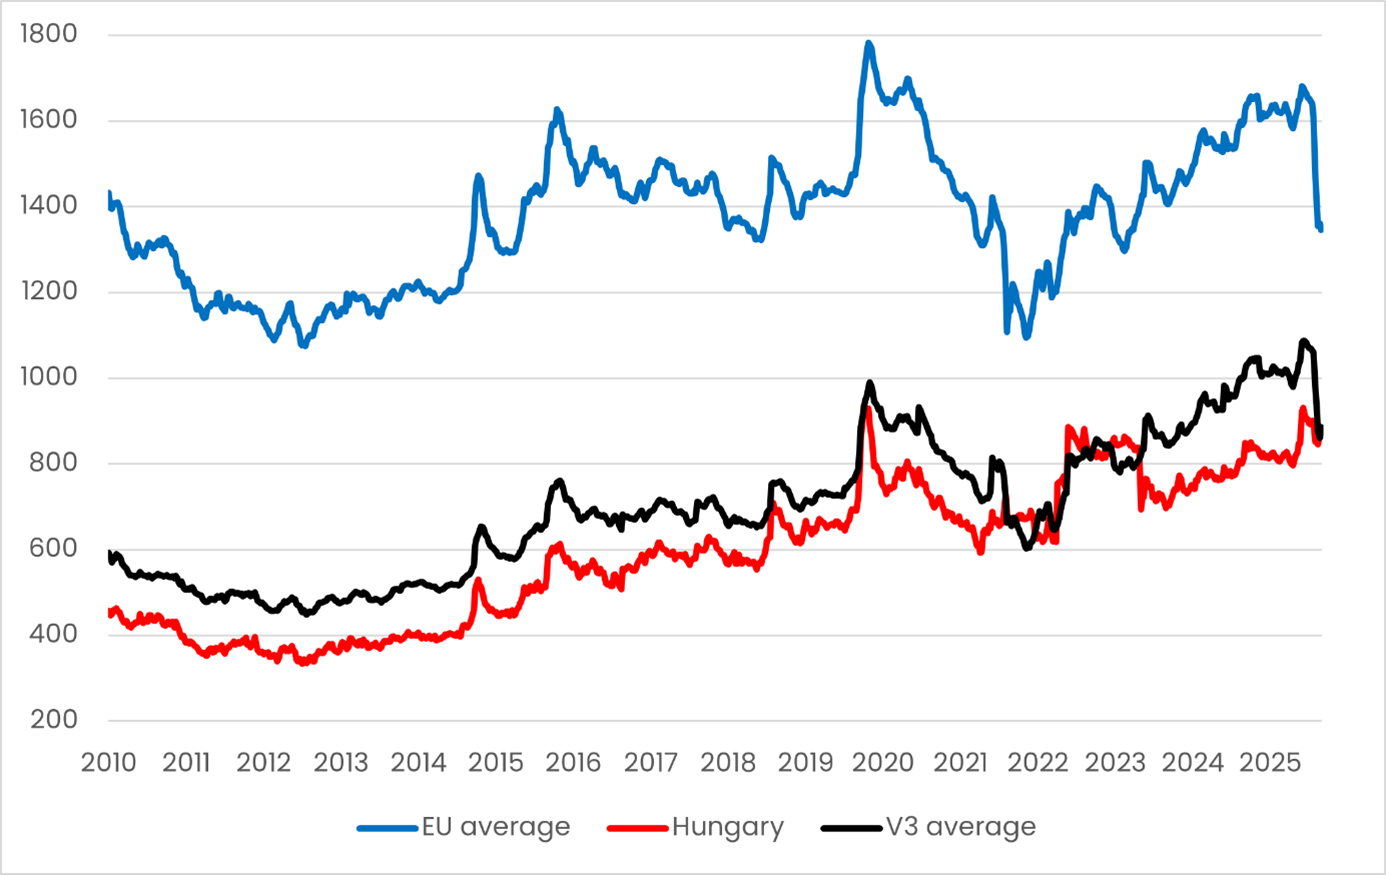
Source: Eurostat , European Commission , Central Statistical Office , Copernicus Lawyers , ACCACE , SUSR [2],[3]
The affordability of fuel in Hungary has improved significantly since 2010 : while at that time it was possible to buy about 450 liters of fuel with an average monthly net salary , before the Iranian conflict this value had already reached 900 liters . As a result of the introduction of protected prices, this indicator has only decreased moderately since then .
In 2010, the average monthly wage in the European Union could buy nearly three times as much fuel as in Hungary . In contrast, in April 2026, as a result of the Iranian conflict, the average monthly wage in the EU was enough to buy only one and a half times as much fuel as in Hungary . Although affordability in the EU has shown only moderate growth since 2010, before the conflict, the average wage could buy 1,670 liters , which fell below 1,350 liters as a result of the crisis . Despite the higher regional real wage dynamics, the EU average is about 460 liters higher than in the V4. This means that even with an EU average wage, the increase in fuel prices is less noticeable in a market environment. In the V3 countries, it is typically possible to buy 100–150 liters more fuel in “peacetime” compared to Hungary, which is a consequence of higher average wages due to fuel prices similar to those in Hungary. However, in crisis situations – as is the case now – this advantage disappears and affordability falls close to the Hungarian level.
Overall, the development of fuel affordability clearly demonstrates that it is not just the price level, but economic policy decisions and income conditions that together determine the actual burden on the population. In Hungary, active interventions in recent years have been able to cushion the impact of market shocks and improve affordability in the short term , especially in crisis situations. However, these tools – especially price regulation – can cause distortions in the longer term and raise sustainability issues .
[1] V3 = V4 without Hungary.
[2] In Hungary, the protected price is converted with the current weekly average exchange rate – so the fuel price change during the protected price / price cap periods results purely from the exchange rate change.
[3]Calculation of net earnings data: estimated from national sources based on Eurostat’s 2024 net earnings data.